
Overview
Dashboards provide a powerful way to view and monitor key metrics in a single place. With fully customizable widgets and multiple visualization options, you can track performance, compare results across reporting periods, and create views tailored to your specific needs.
Whether you're monitoring fund performance, portfolio activity, investment metrics, or company reporting data, dashboards help you bring the information that matters most together in one centralized view.
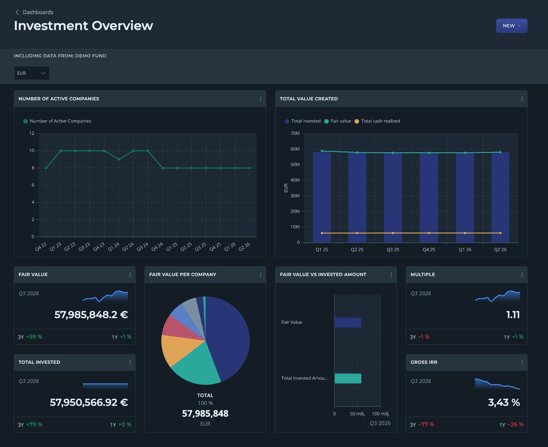
Creating a Dashboard
There are two ways to get started:
Build from Scratch
Create a completely custom dashboard by adding your own selection of widgets. Choose the metrics, chart types, and layouts that best support your reporting and analysis needs.
Use a Template
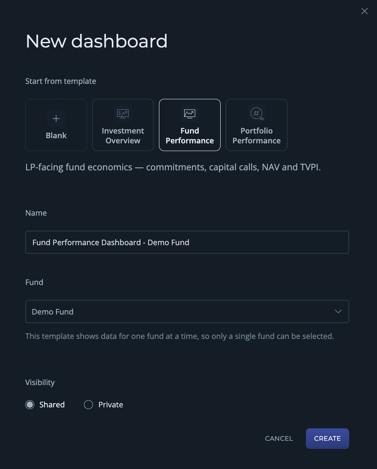
If you'd like to get started quickly, you can create a dashboard from one of the available templates:
- Investment Overview
- Fund Performance
- Portfolio Performance
Templates provide a ready-made starting point that can be further customized at any time.
Customizing Your Dashboard
Dashboards are fully flexible and can be tailored to suit different reporting requirements.
You can:
- Add any combination of widgets
- Display metrics across different reporting periods
- Choose from multiple chart and visualization types
- Rearrange widgets to create your preferred layout
- Modify dashboards at any time as your reporting needs evolve
- Utilize labels when creating charts to narrow results down to your preference
For example, you might create separate dashboards for:
- Individual funds
- All funds combined
- Portfolio-level performance
- Fund-level performance
- Investment-specific monitoring
There is no limit to the number of dashboards you can create.
Sharing Dashboards
When creating or editing a dashboard, you can decide who can access it.
Shared Dashboards
Shared dashboards are visible to other members of your team, making it easy to standardize reporting and collaborate around the same set of metrics.
Private Dashboards
Private dashboards are only visible to you and can be used for personal monitoring, analysis, or work-in-progress reporting.
You can choose the visibility setting that best fits the purpose of each dashboard.